Treemaps as tool to visualise software projects
Software development as an industry does not rely heavily on a graphical representation for finding out issues or patterns in a system. There have been myriad charting techniques tested to get an overview of the code base but none have stuck or have worked for systems of all sizes.
The desire to visualise a code base becomes more apparent when you need to troubleshoot problems or see trends in changes to a system based on pre-defined metrics. Visualising also helps in understanding trends and troubleshooting problems. Something as trivial as tracking effort spent in fixing technical debt and avoiding it by reducing complexity could save a business millions, not only in terms of hours spent but also by delivering a stable, better product that does not require as much support. The very possibility of defining a product road map based on how software behaves is quite titillating.
However, to get there you need to track these trends and understand how to spot them earlier to make changes to your process or code. There are many factors that contribute to selecting the right way to graphically represent a code base - it needs to be understood by middle management and quality gate keepers without delving into the code; roles that do not work directly on the code base but already understand the broad strokes of the system architecture.
- it needs to give the management an eagles-eye view of the system highlighting problem areas and deltas.
- it needs to give pointers to the engineer to be able to dive into the code base and fix the problem
When you consider all of these factors, and the fact that almost all code bases loosely depict a hierarchical tree system you start looking at charting techniques available for tree-like data structures - Treemaps start coming out as an obvious choice. This is a method for displaying hierarchical data using nested figures, usually rectangles. You could read more about treemaps in the 1991 paper by Ben Shneiderman and Brian Johnson - Tree-Maps: A Space-Filling Approach to the Visualization of Hierarchical Information Structures.
The main distinguishing feature of a treemap, is the recursive construction that allows it to be extended to hierarchical data with any number of levels. We use treemaps to display code bases with millions of code units. This scales well and allows you to slice and dice your code base in a way that’s approachable, stable and preserves the ordering of the displayed directories/ code units (after filtering you do not end up with a different looking map). This makes code analysis fun with treemaps.
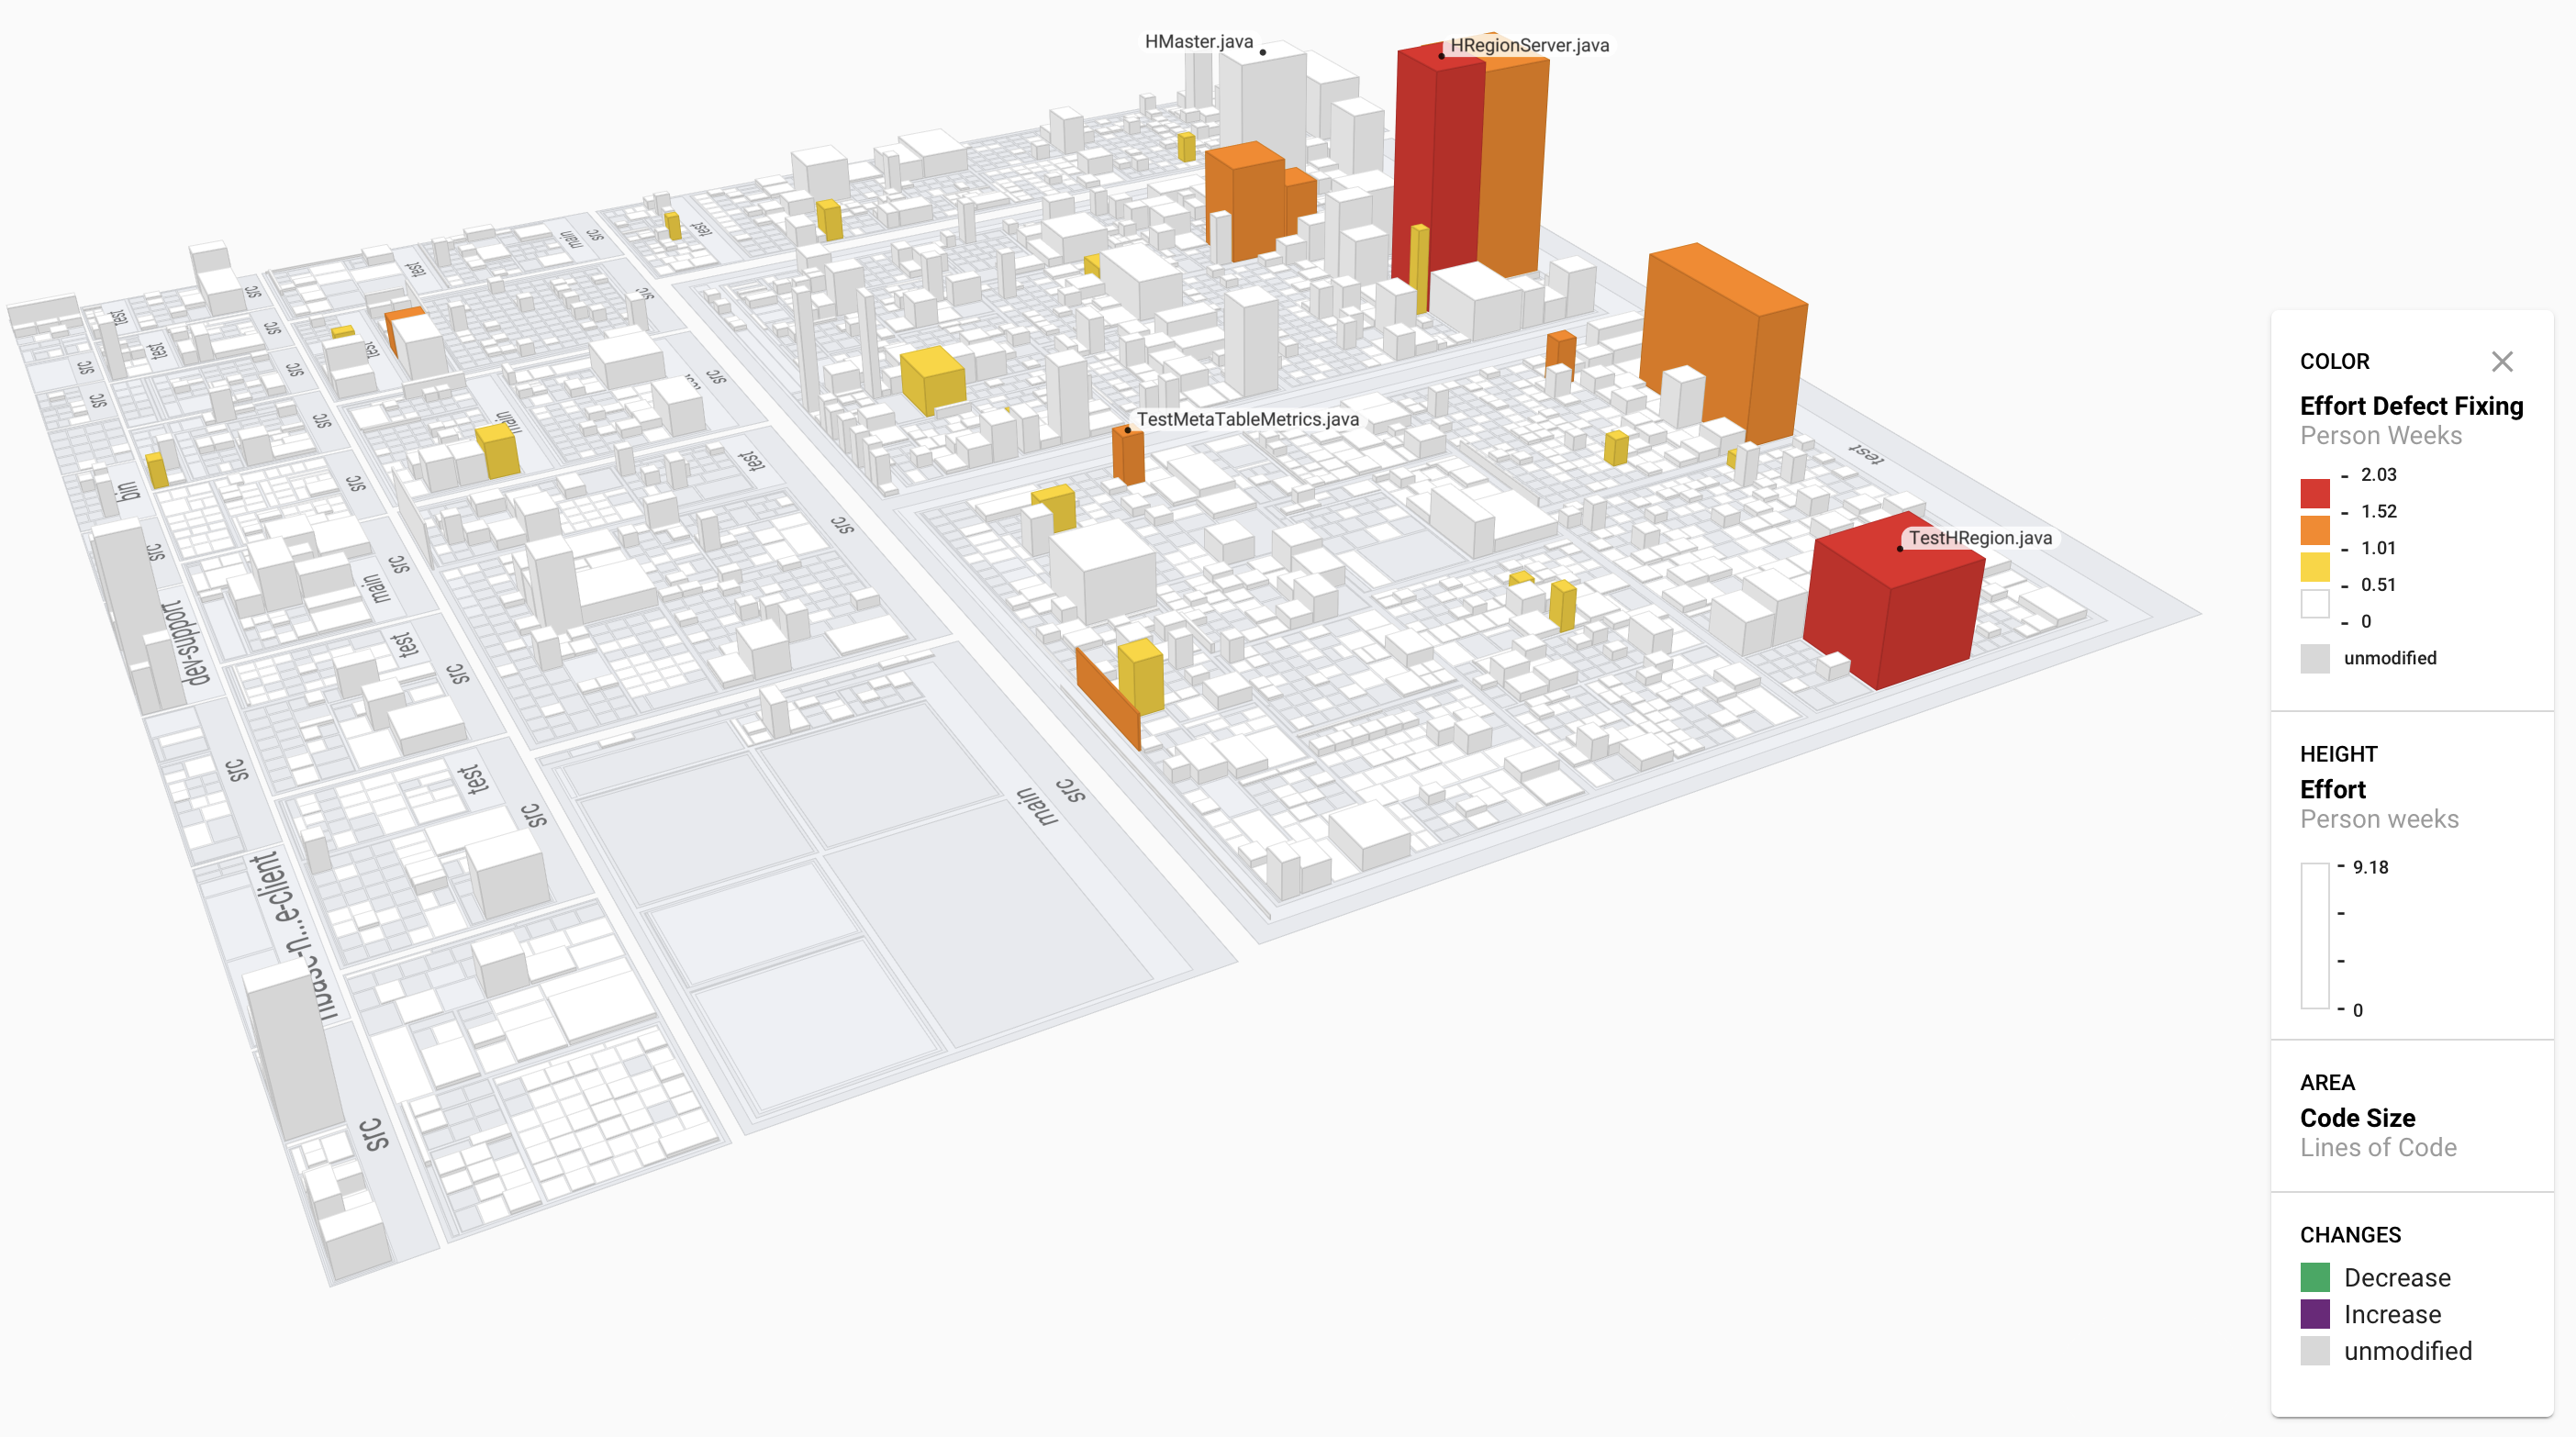
All this preaching about treemaps without going through an example of how this works in practice would not be fair, so I will be running you through finding out how much effort was invested in bug fixing for the HBase project under Apache in the last year, from 23rd November 2018 to 22nd November 2019.
HBase is an open source project with Apache and has a lot of contributors, however, the same principles could be applied to any code base for any metric.

This treemap shows code units with the amount of effort all developers have put in only related to bugs that have been raised.
This chart was generated using Seerene and is from a test account from those days.
You could get a better understanding with tools like Seerene where you cross reference this map with a list of revisions that touched only that particular code unit and then one can continue digging deeper by setting targets or even understanding how often a build was broken due to a bug.
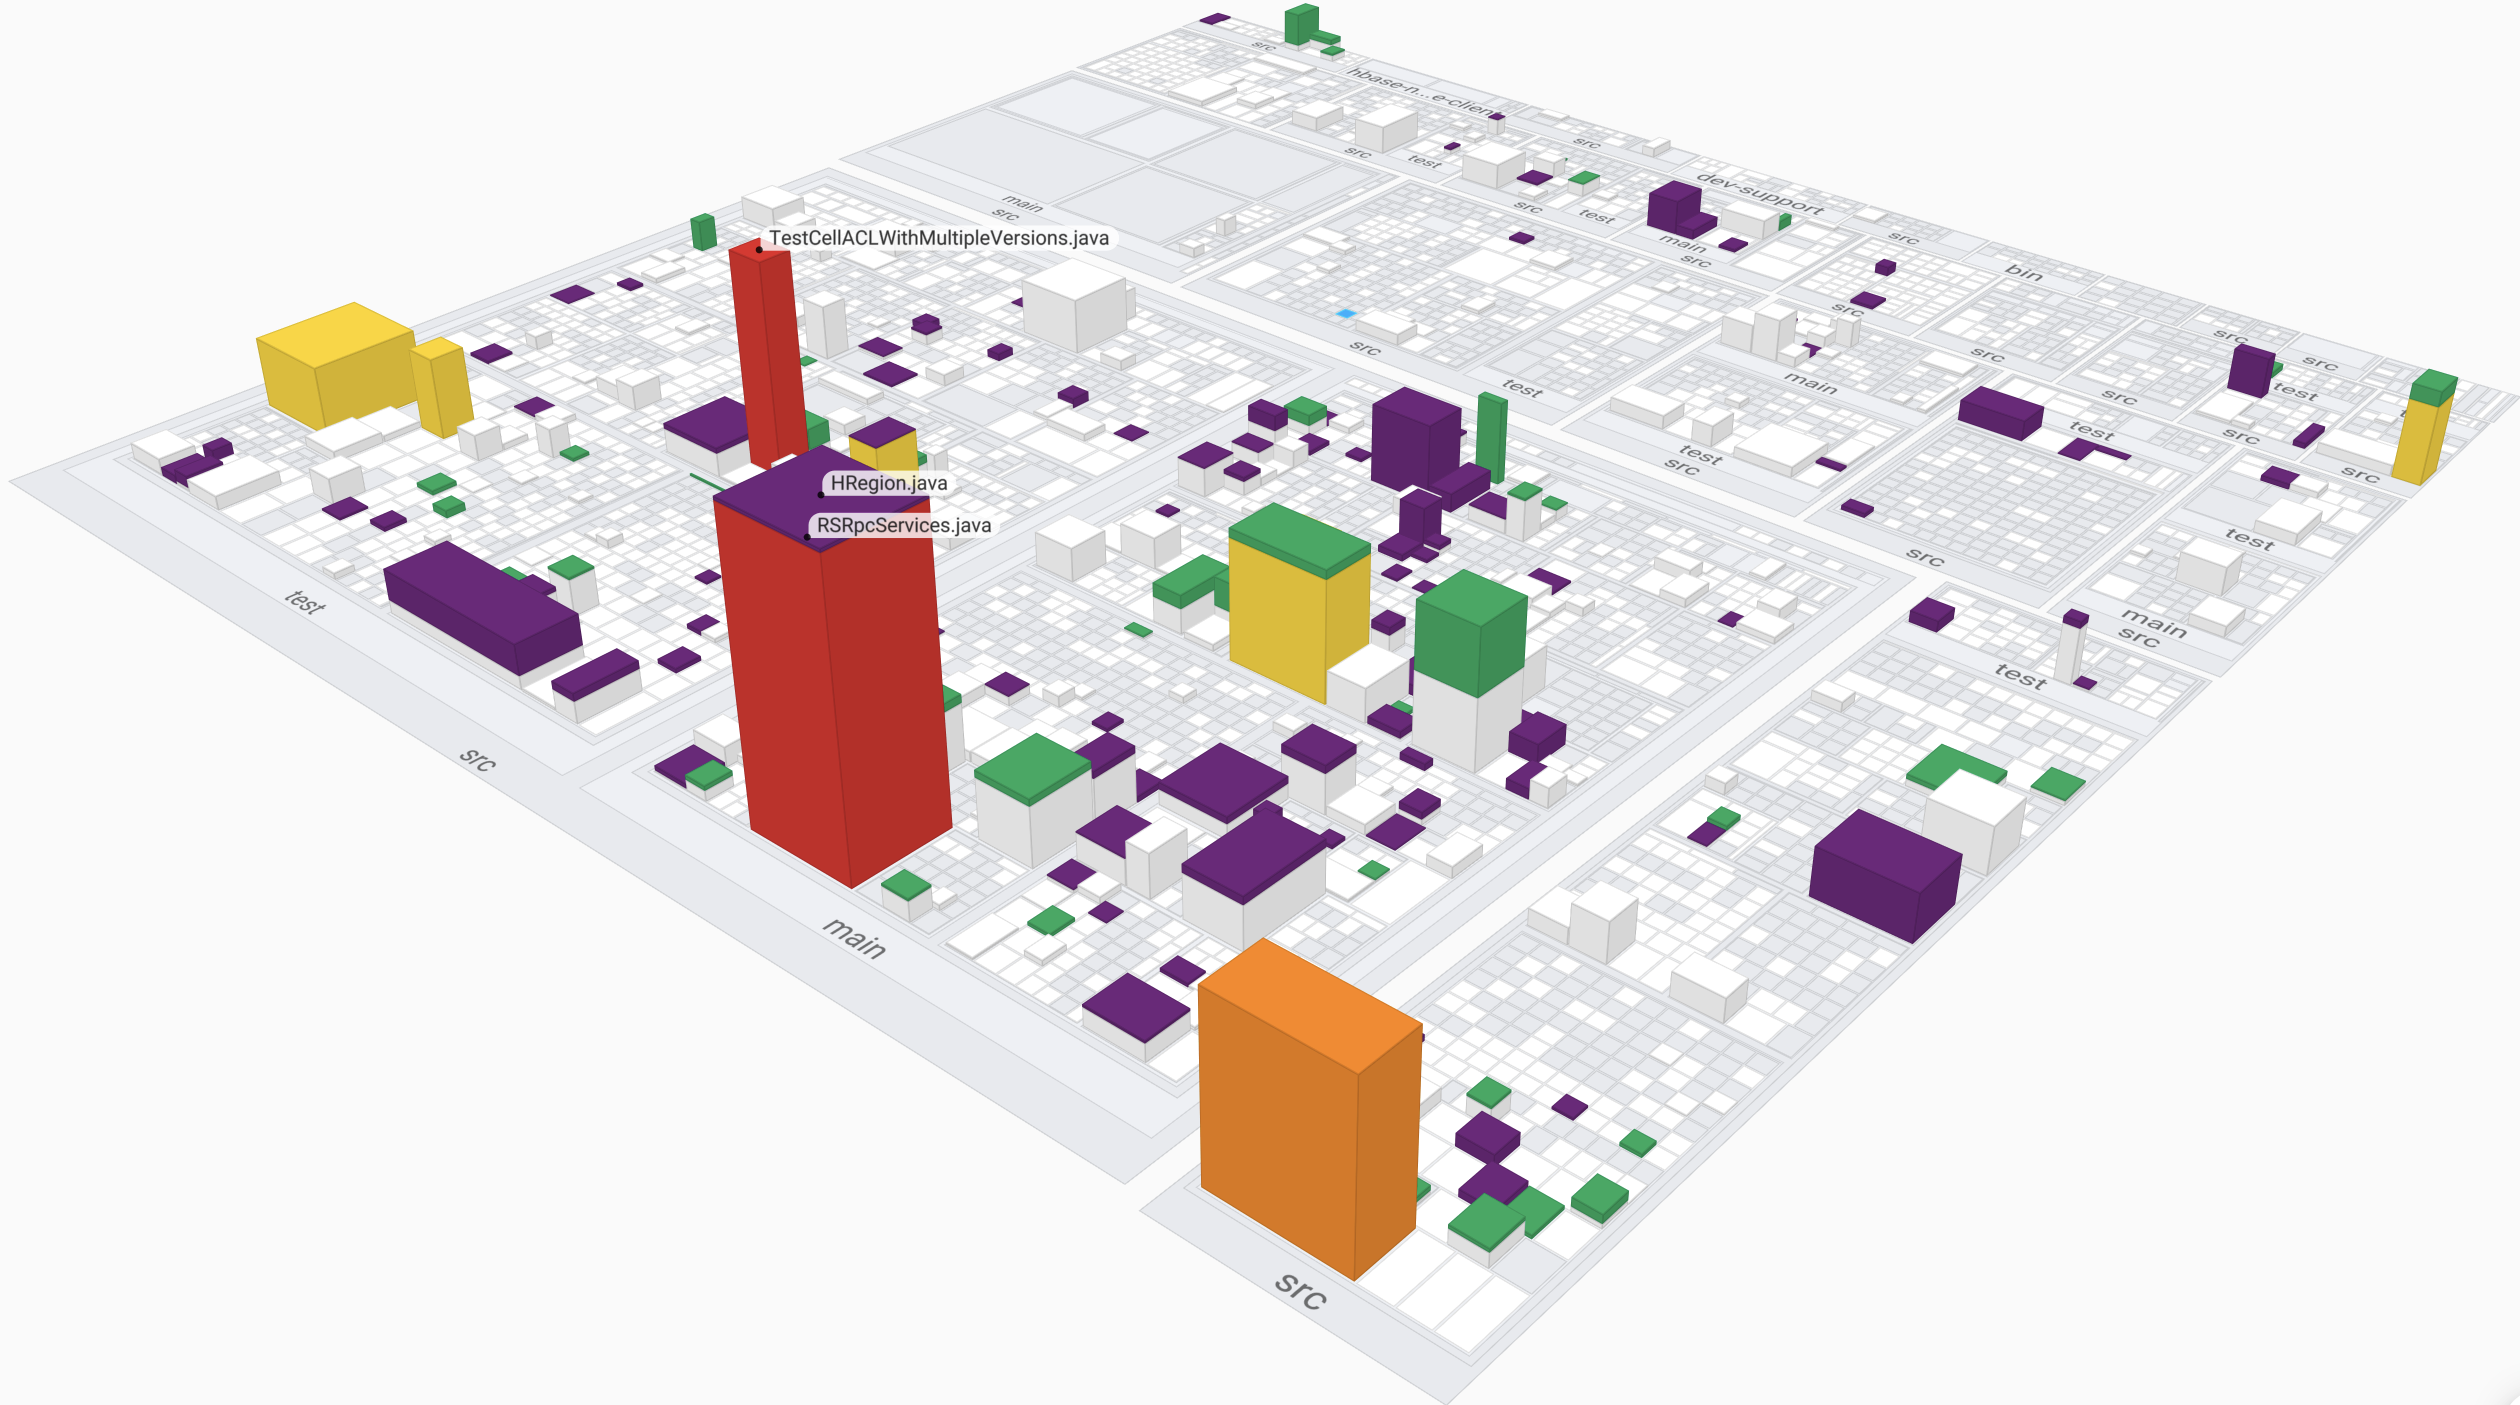
Here is another example showing complexity of the same code base over the same period.

Treemaps have traditionally been 2d, however, taking it into the 3d space lets you plot metric values for your code base that give you another dimension of troubleshooting. Like in the example above, you get the lines of code from the area of the chart but the heights are metric values for effort put into defect fixing. Our treemap implementation is not purely 3-dimensions, we work in two and a half dimensions (2.5D). Working in 2.5D means we are cutting a part that has multiple flat features at varying depths. During a 2.5D cutting process, the Z axis positions itself to a depth where the X and Y axes interpolate to cut a code unit. The Z axis then retracts so the X and Y axes can move to the start point of the next code unit, which may be cut at a different Z depth than the last code unit.
As you delve deeper into this, you realise treemapping at the very core it is a simple charting technique but when paired with key performance indicators that show changes to a code base over time, treemaps have the potential to be the single source of truth that a C-level executive or a project manager needs to look at to depict trends with the product.
I hope this post starts getting you thinking in a positive way to analyse software development, from a bird eye view to get a better understanding how your projects are running.